


Wealth Creation in the Stock Market (1926–2019)
MMN Recommend

Hey,
Here's a newsletter we've been following ourselves, The Pareto Investor.

It cuts through the noise and focuses on the few stocks that drive most of the market’s returns.
It's an amazing compliment to Money Machine Newsletter. We know our readers enjoy more than average returns, which is why we recommend it.
I'll let The Pareto Investor take over from here...
A Deep Dive into 26,168 Firms Compared to One-Month Treasury Bills Uncovers Game-Changing Insights for Long-Term Investors

Dear Investors,
The U.S. stock market has been a cornerstone of global wealth creation for nearly a century, serving as a powerful engine for economic growth and a transformative force for investors.
However, this monumental wealth creation is neither evenly distributed nor consistent across industries and time periods.
Understanding the intricacies of this phenomenon reveals three critical dimensions:
The extraordinary concentration of wealth creation in a select few companies
The divergent performance of industries
The historical trends that have shaped the market over time
Spanning nearly a century (1926–2019), Hendrik Bessembinder’s study unveils a startling reality: a disproportionate contribution of a small number of companies to overall market returns.
"Only 4 percent of all publicly traded stocks account for all of the net wealth earned by investors in the stock market since 1926"
—Hendrik Bessembinder
A staggering 57% of publicly listed firms from 1926 to 2019 reduced shareholder wealth, while a mere 0.32% of companies accounted for half of the total $47.38 trillion in wealth generated during this period.
This skewed distribution underscores the “winner-takes-all” nature of modern markets, with giants like Apple, Microsoft, and Amazon dominating the narrative.
Equally compelling is the performance of industries within this broader framework.
While technology firms have garnered the spotlight, sectors like telecommunications, healthcare, and energy have consistently outperformed expectations relative to their representation in the market.
These findings illuminate the diverse pathways through which shareholder wealth has been created, highlighting industries with untapped potential alongside established leaders.

Ssrn 3537838
391KB ∙ PDF file
A historical perspective reveals how periods of growth and contraction have shaped the evolution of wealth creation.
From the devastation of the Great Depression to the explosive growth driven by technological innovation, the U.S. stock market has weathered and thrived through various economic cycles.
Recent years, particularly 2013 to 2019, have witnessed unprecedented acceleration in wealth generation, driven by the rise of internet-based economies and technology titans.
This exploration of the concentration of wealth, industry-specific insights, and historical trends offers a comprehensive lens through which to view the dynamics of wealth creation in the stock market.
For investors, understanding these dimensions is key to navigating the complexities of portfolio strategy and uncovering opportunities in a rapidly evolving financial landscape.
1. Wealth Creation in U.S. Stock Market (1926–2019)
The U.S. stock market has been a powerhouse of wealth creation for nearly a century, delivering unparalleled returns to investors.
Yet, this wealth generation is far from evenly distributed.

A recent study reveals that the lion's share of shareholder wealth is concentrated among a small subset of companies, highlighting a striking disparity in performance.
The Concentration of Wealth Creation
Between 1926 and 2019, the U.S. stock market generated $47.38 trillion in shareholder wealth relative to Treasury bill benchmarks.
Astonishingly, over 57% of the 26,168 publicly listed firms during this period reduced shareholder wealth, leaving just 42% contributing positively.
Even within this 42%, the concentration is pronounced:
The top five firms—Apple, Microsoft, Exxon Mobil, Amazon, and Alphabet—accounted for nearly 12% of all wealth creation.
A mere 83 companies (0.32% of the total) generated half of the total market wealth over this 93-year span.
This trend has intensified in recent years, with five firms alone (Apple, Microsoft, Amazon, Alphabet, and Facebook) contributing 22.1% of the wealth created between 2017 and 2019.
These results underscore the "winner-takes-all" dynamic that increasingly defines modern equity markets.

Today, the concentration of wealth creation in U.S. stock markets is both a challenge and an opportunity for investors.
Recognizing this reality can help investors craft strategies aligned with their risk tolerance and investment goals.
For those without specific stock-picking expertise, broad index funds can mitigate the risk of underperformance, ensuring exposure to the few top-performing firms that drive market returns.
However, investors seeking to outperform the market might consider sectors with high wealth creation efficiency, albeit with increased risk.
Industry dynamics play a critical role in wealth creation, and understanding these nuances can empower investors to make informed decisions.
2. Industry Insights
The U.S. stock market’s ability to create shareholder wealth varies significantly across industries.
Industry dynamics play a critical role in wealth creation, and understanding these nuances can empower investors to make informed decisions.
From the dominance of technology firms to the outperformance of healthcare and telecommunications sectors, a closer examination reveals key insights for industry-focused investors.
Top Performing Industries
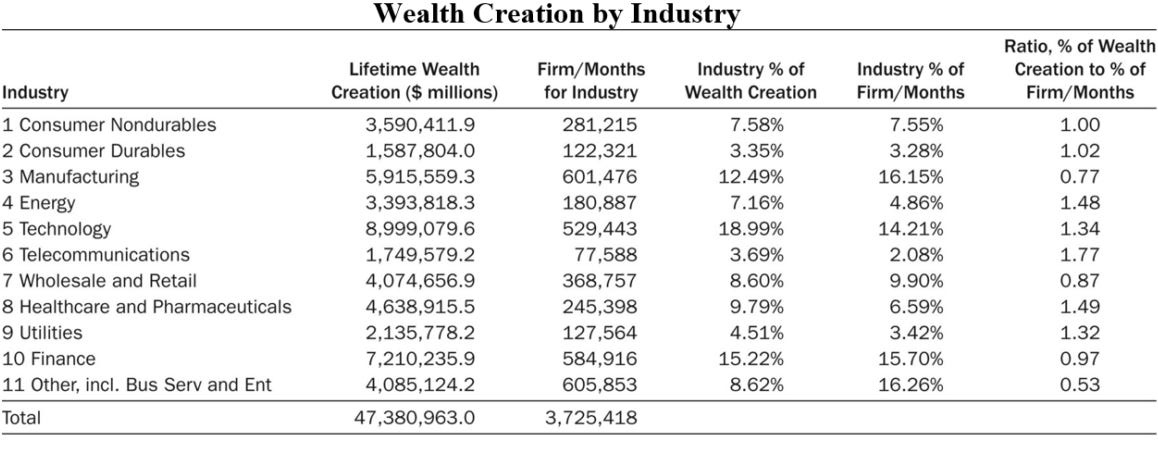
Of the $47.38 trillion in wealth generated from 1926 to 2019:
Technology:
Leading the charge, technology firms contributed $9.00 trillion (19% of the total). Companies like Apple, Microsoft, and Alphabet were standout performers, demonstrating the industry's potential for exponential growth.Finance:
Financial firms followed with $7.21 trillion (15%), reflecting their stability and consistent returns over time.Healthcare and Pharmaceuticals:
With $4.64 trillion (10%), this sector punches above its weight, reflecting its resilience and growth driven by innovation and demographic trends.
While technology garners the most attention, it is not the most efficient wealth generator relative to its size:
Telecommunications:
Despite representing just 2.08% of all firm-month observations, this sector accounted for 3.69% of total wealth creation, yielding a wealth creation-to-representation ratio of 1.77—the highest among industries.Energy and Healthcare:
Both sectors significantly outperformed their representation in the market, showcasing their long-term value creation capabilities.
These findings suggest that investors seeking to outperform the market might consider sectors with high wealth creation efficiency, such as telecommunications and healthcare, alongside the undeniable growth potential of technology.
Market concentration by sector; the rise of Technology
Another form of market concentration that has emerged in markets over recent years is at the sector level, particularly with the rise of the technology sector.

Once again, this is more obvious in the US than in other markets, but it has become a feature of many other markets too, particularly in Asia.

It is also worth remembering that the current dominance of the technology sector, even in the US equity market, is not unprecedented relative to other dominant sectors in the past.
3. Historical Trends
Over nearly a century, the U.S. stock market has been a fascinating case study in wealth creation, punctuated by periods of intense growth and catastrophic downturns.
A detailed examination of historical trends reveals how wealth creation has evolved over time.
Technology has played a pivotal role, with firms like Apple and Microsoft transforming industries and generating massive returns.
Today, the Information Technology industry is the biggest but this is by no means exceptional.
Over the past 200 years, the biggest industry represented in the stock market at each point in time has reflected the major driver of economic growth.
The Technology sector is about the same size as the Energy sector was at its height in the mid-1950s.
It remains smaller in the index than both Transport (which dominated in the 20th century) or finance and real estate which drove the dominant part of the equity market in the 19th century.

This is high by historical standards, although not unique.
The equity market had a higher share in the global markets in the early 1970s, although the drivers were very different.
In that period, the seven largest companies belonged to the oil sector (Exxon and Mobil), the autos sector (Ford, GM and Chrysler) together with General Electric and IBM.

Historical patterns suggest that wealth creation is cyclical, with periods of concentration often offering opportunities for long-term investors to capitalize on industry leaders, and prioritize innovative companies that drive change.
The Evolution of Wealth Creation:
1770s: Finance
1850s: Transport
1920s: Energy
1980s: Information Technology
2030s: Artificial Intelligence?
 Tops $3 Trillion in Market Value, Overtaking Apple (AAPL) - Bloomberg")
Emerging sectors like AI and semiconductors may be the next era of wealth creation.
Navigating Wealth Creation in a Complex Market Landscape
Understanding historical trends provides investors with valuable context, helping them anticipate future market dynamics and position their portfolios for success.
The wealth creation in the U.S. stock market offers profound lessons for investors seeking to optimize their portfolios.
The extraordinary concentration of wealth in a select few companies emphasizes the importance of exposure to market leaders.
At the same time, the nuanced performance across industries reveals opportunities in sectors that may be undervalued or overlooked.
Finally, the historical trends in shareholder wealth remind us of the cyclical nature of markets and the resilience they demonstrate over time.
For investors, these insights serve as a guiding framework.
Whether you prefer the stability of diversified strategies or the calculated risk of focused investments, the data underscores one key principle: long-term success requires aligning your strategy with your goals and risk tolerance.
Recognizing that a small fraction of companies drives the majority of market returns, it’s vital to remain vigilant, informed, and adaptable in a market defined by innovation and disruption.
Sincerely,
The Pareto Investor